Unlock the Power of SAP Analytics Cloud Dashboards integrated with SAP Commerce for Your Business
Are you keeping up with all the key metrics of your business? Do you know how to effectively track your revenue and customer behaviors over time? If not yet, we have something that might completely change the way you view data in your company.
Experience Our Solution in Action: Explore the Live Demo
Get a real feel for our solution with our live demo. It’s a straightforward way to understand its features and how it can work for you. Click ‘Start Tour” to start exploring now.
Intuitive Dashboards in SAP Analytics Cloud fully integrated with SAP Commerce
SAP Analytics Cloud provides advanced dashboards for detailed analysis and improved understanding of business operations. The tools are geared to deliver insights beyond just raw data, helping to interpret their significance. Additionally, integration with SAP Commerce offers a complete overview of e-commerce activities, aiding in more informed decision-making.
Account SAC Dashboard
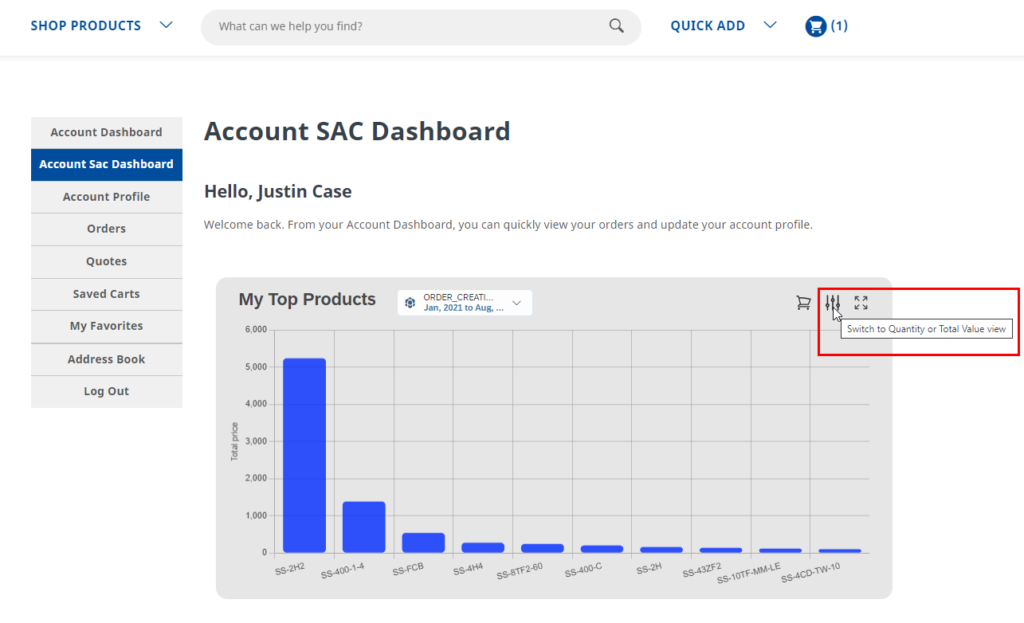
In SAP Commerce we've created new section Account SAC Dashboard. This is where you can view various dashboards with data that’s specific to you. Each customer's dashboard reflects their own sales results. Your customer can quickly see top-selling products and add them to the cart directly from the chart.
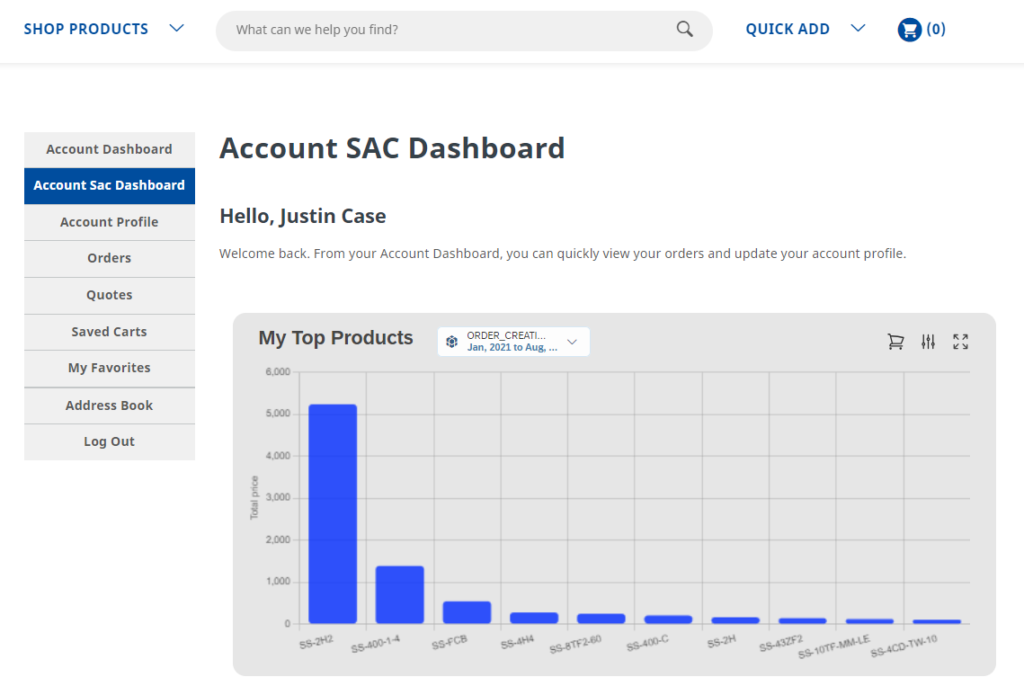
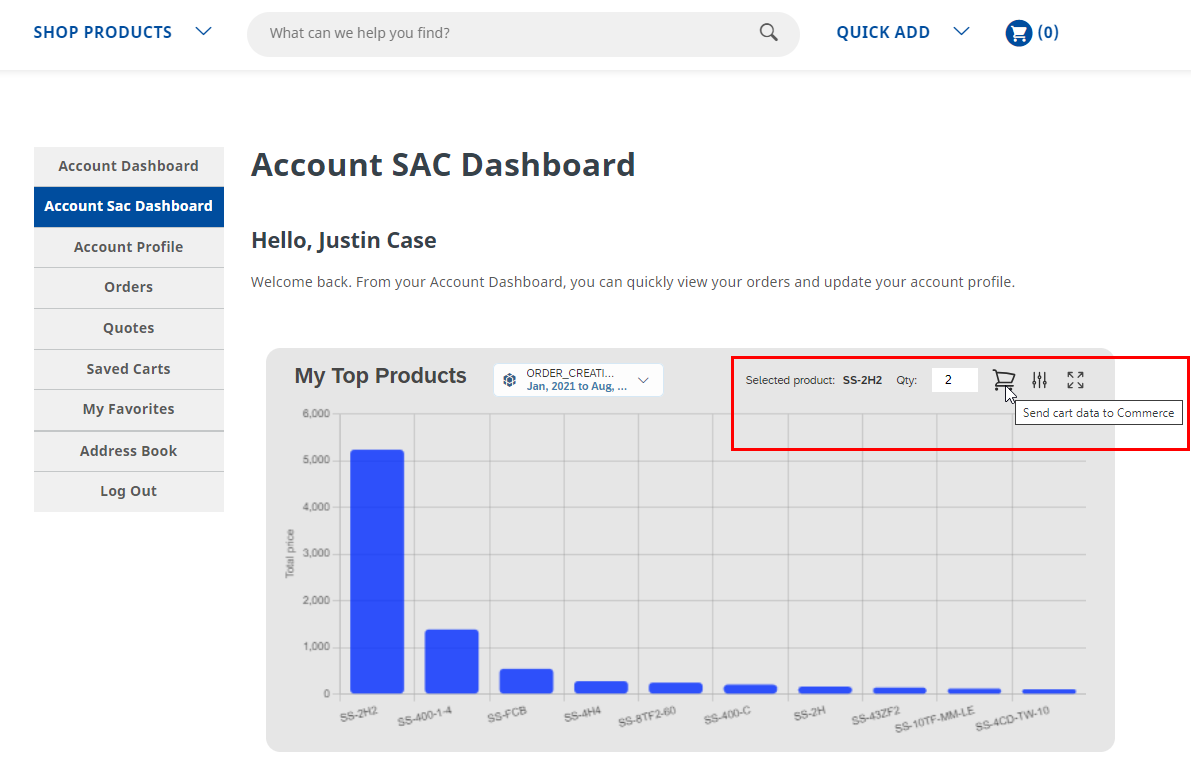
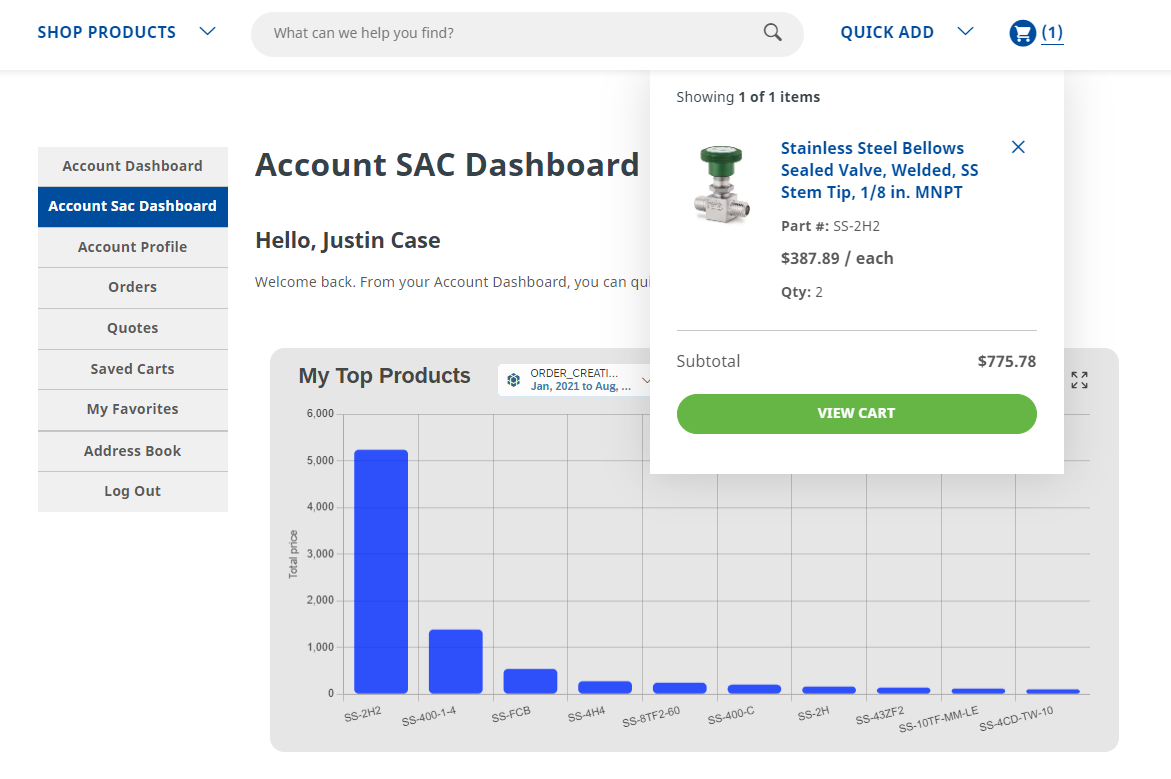
Adding products to cart
- Choose product by clicking the chart
- Set quantity
- Click the "Cart" icon
- Product is added to cart
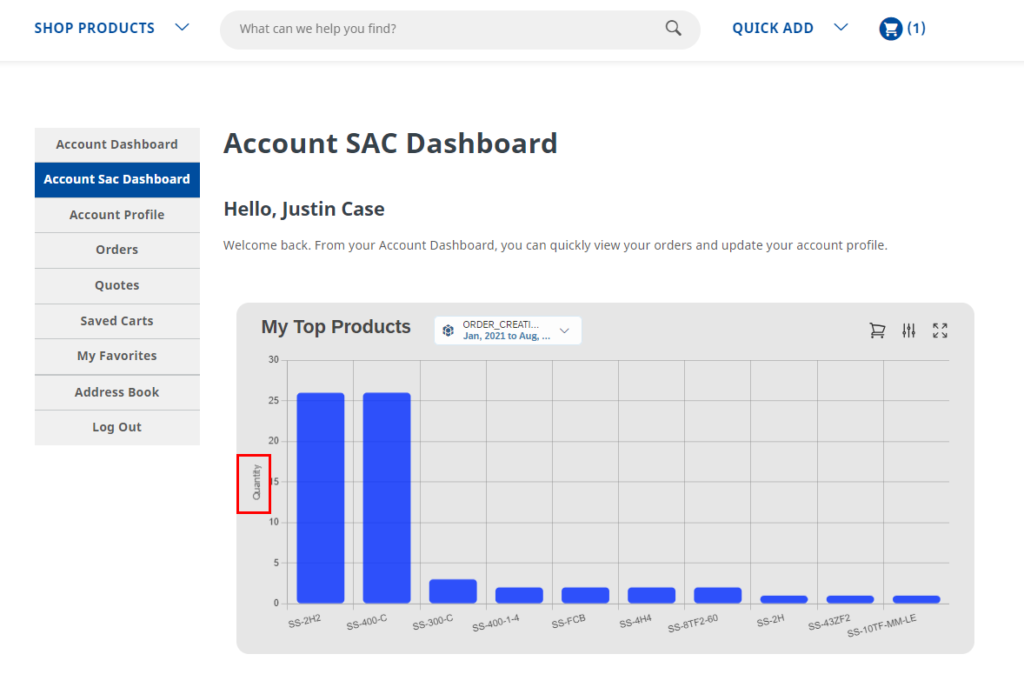
Switching to Quantity view
You can easily switch the view from Total Price to Quantity and vice versa with just a single click of a button.
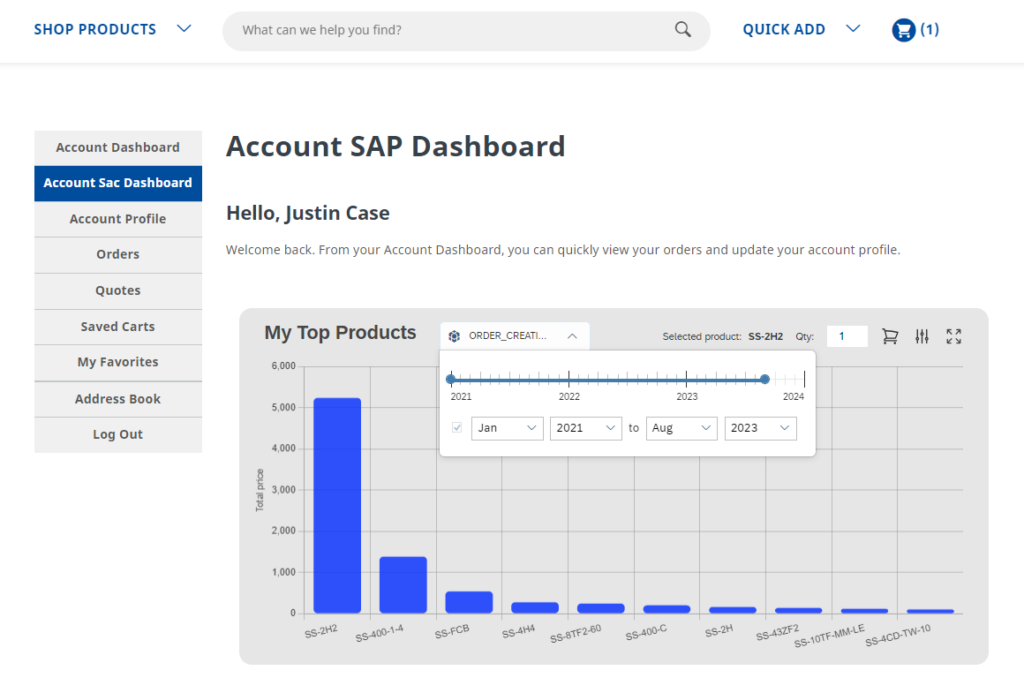
Date filtering
You can change the dates to see sales from the time period you're interested in. Just pick the start and end dates to get the specific data you need.
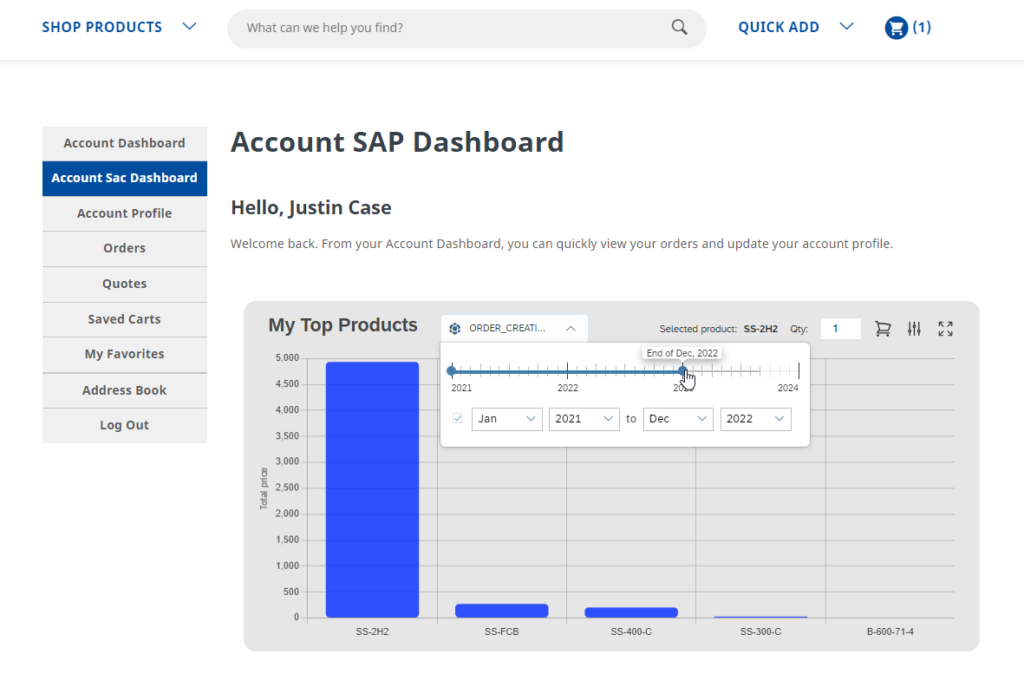
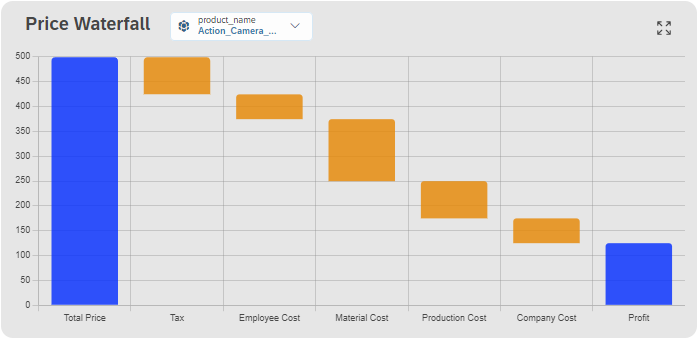
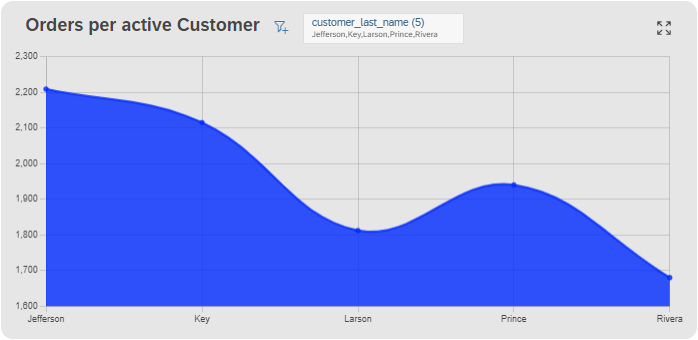
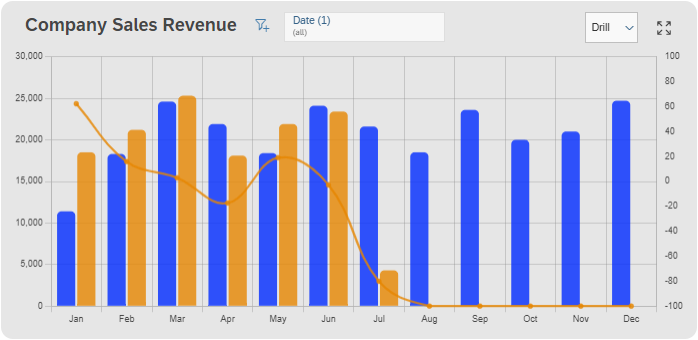
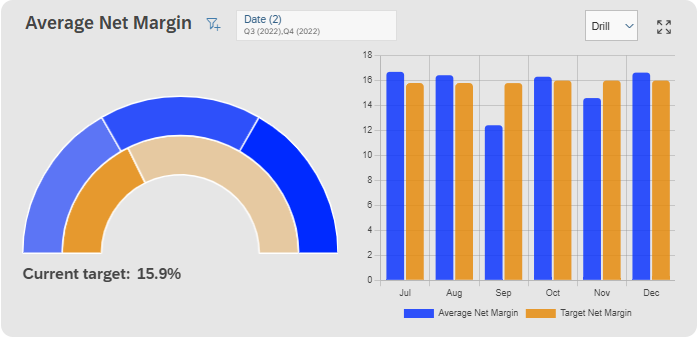
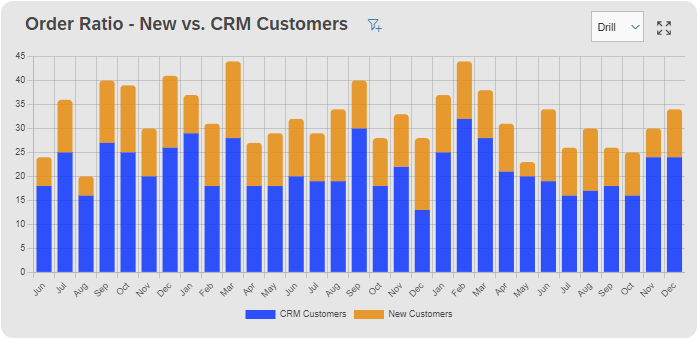
My Top Products is just one of our many dashboards. Below, you can find more examples:
SAP Analytical Cloud Integration with Chart.js
Chart.js is a free, open-source JavaScript library designed for crafting HTML-based charts. It is widely used for displaying data in various chart types, such as bar charts, line charts, pie charts, and more.
We've seamlessly integrated Chart.js to quickly achieve a visually impressive look and feel for our dashboards.
Advantages of using Chart.js
- Fluent animations, fast loading
- Fully Customizable (fonts, colours, paddings etc.)
- Actively developed and supported
- Well suited for large datasets
- Responsive
- MIT licenced
- Mixed Charts (combination of two or more different chart types)
How It Works
Our dashboards are designed with ease of use in mind. You can easily create personalized views that focus on the data most important to your business, such as revenue over a specific time period, customer behaviors, as well as market forecasts and trends. Thanks to integration with SAP Commerce the data is updated 24/7
Key Benefits:
- Revenue Monitoring and Trends Tracking: Keep track of your revenues over different time periods and identify key trends.
- Customer Behavior Analysis: Understand how customers interact with your business and how it impacts your results.
- Customized Reports: Create reports tailored to your business needs without needing any programming skills.
Make Smarter Business Decisions
SAP Analytics Cloud enables you to access and utilize data effectively for informed decision-making, which can contribute to business growth and maintaining a competitive edge.
We welcome your feedback and questions. Contact us to learn more about how SAP Analytics Cloud can support your business.
Please, check our other news regarding your business
- Cloud TPM: The Ultimate Trade Promotion Management Suite on SAP Business Technology Platform
- Robotic Process Automation – SAP: Streamlining Your Business Processes
- NSP SAP Marketing and Google Firebase – Push Notification App
- SAP Commerce – Dialogflow Chatbot
- SAP Commerce – PunchOut
Need More Information?
Our experts are ready to assist. Email: bartosz.szumiel@nsp.biz.pl, Phone: +48 604 279 798

